

AGRICULTURE & FISHING
We hope that the dashboard will be a useful tool for anyone who chooses to look at it, including those who are not food systems “experts.” For those who would like more context, we have developed these introductory resources. Data and materials here are about the whole New England food system (not just the part related to institutions).
This page provides background about food production, processing, and distribution in our region. It uses data from the 2017 USDA Census of Agriculture to show the current agricultural landscape in New England, and how this landscape has been changing over time.

Agriculture
Change in the Number of Farms in New England States from 1910 to 2017
Over the last century, the number of farms has decreased drastically across the region, especially between 1945 and 1969. Causes of farmland loss include urbanization, poor land use planning, and the challenging economic situation that farmers face in trying to make a living off the land.
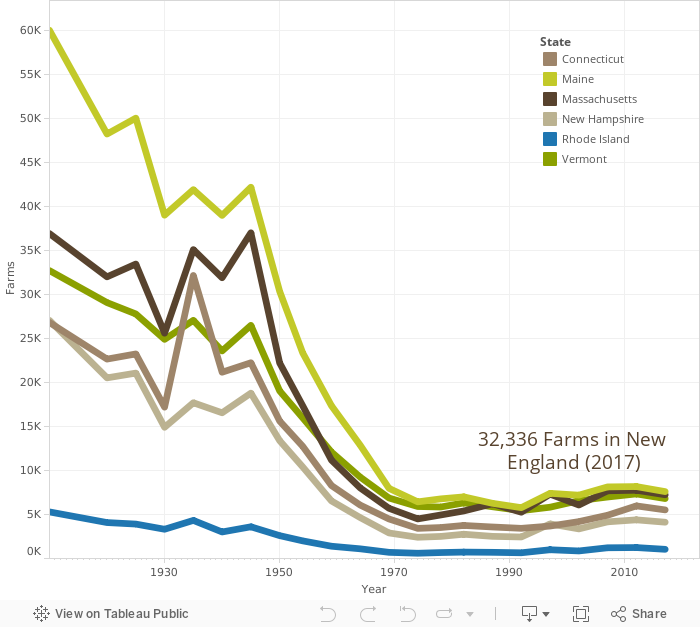
Source: USDA 2017 Census of Agriculture
Change in Acres in Agriculture in New England States from 1982 to 2017
American Farmland Trust estimates that we lose about 40 acres of farmland across America every hour. Over the last few decades, New England states have been working hard to maintain the acres they have remaining in farmland. Preservation programs and practices have become more widespread and an increasing interest in eating local contributed to all states actually increasing the acres they had in farmland between 2002 and 2012, although the total acres in agriculture decreased slightly in 2017.
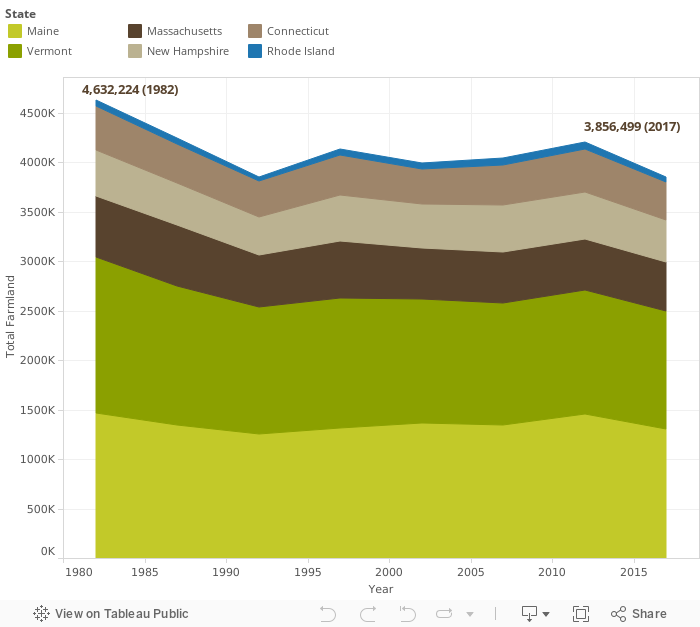
Source: USDA 2017 Census of Agriculture
Organic Agriculture in New England
About 5% of New England’s farms are certified organic (1715 farms). In 2017, total organic sales were $231.8 million dollars.
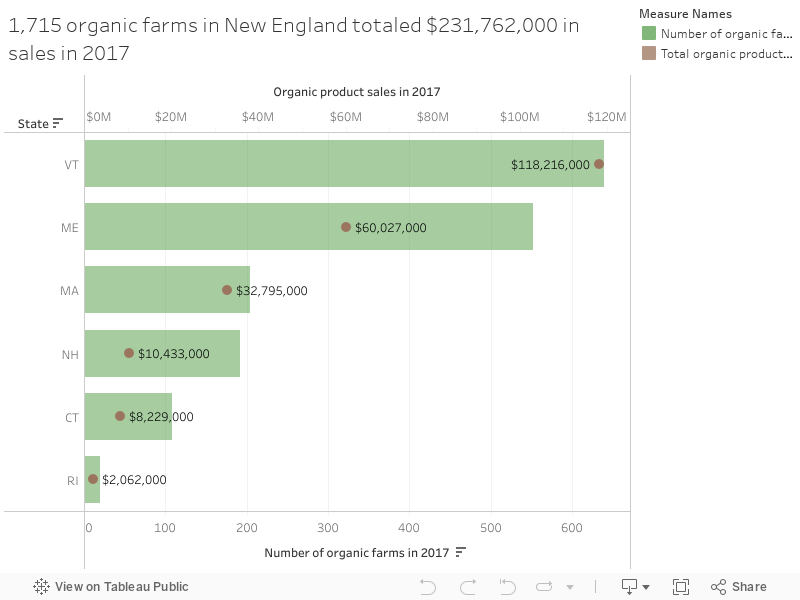
Source: USDA 2017 Census of Agriculture
Sales/Commodities
The source of the following metrics is the USDA 2017 Census of Agriculture.
Demographics


Photo courtesy of Colby College
Fishing
Fishing and seafood are an important part of the New England food landscape, both economically and culturally. Unfortunately, fisheries are under threat from climate change, over-harvesting, and pollution – including nutrient and pesticide runoff from agriculture. As with other food systems challenges, creating a sustainable seafood industry will require varied and complementary approaches.
Job Impact of Fishing Industry
With 473 miles of coastline, a long history of fishing communities, and the continued popularity of seafood, fishing remains an important part of the New England food system. For the past 16 years, New England has been home to the highest value fishing port in the United States in New Bedford, Massachusetts. In 2015, the fishing industry accounted for nearly 140,000 jobs across the region. As shown in the graph below, retail accounts for 53.2% of fishing industry jobs, followed by commercial harvesters at 22.6%.
Data visualization coming soon.
Value of Key Species
Landings data indicate the total price that fishermen and women are paid for their catch of “key species.” Selected by NOAA, key species are those that have “economic and/or historical significance to a state or region.” In New England, these species are: American lobster, Atlantic herring, Atlantic mackerel, bluefin tuna, cod and haddock, flounders, goosefish, quahog clams, sea scallops, and squid. By far, lobster and sea scallops account for the highest landed value in New England.
Data visualization coming soon.